Student Grade
Prediction
COMPANY OVERVIEW
In one of the Canadian provinces, there is a publically funded college that provides technical, academic, vocational or a mix of programs that are exclusive to the said province's education system.
The purpose of this separate collegiate education is to make post-secondary education more accessible to the residents of the province, and also to ensure that students have proper academic prepartion to succeed at university.
THE CHALLENGE
A wave of students in the province is failing in the subjects of Math and French. The province's success rate is 74% whiles other provinces' are closer to 90%.
The ministry of education is looking understand the problem, and design initiatives and strategies to decrease failure rates and improve student performance in the province. Their main goal to be able to predict the final score of a student, early on in the semester. This will enable them to identify students who need assistance and then provide the necessary supports to ensure the students excel.
TOOLS utilized
SQL for Data Extraction
Excel for Data Exploration
Alteryx and Tableau for Data Analysis


tHE APPROACH
Requested brief description of required data from information systems team
Performed ETL - extracted, transformed and loaded the data
Performed exploratory analysis of the data
Utilized multiple regression analysis to identify the significant variables
Identified how the attributes/features correlate with the student's final grade and with each other
Split the data for training and testing
Created a machine learning model that predicts the final grade of a student early in the semester
POSITIVE CORRELATION
The following attributes had a postive correlation with the final score, G3:
Higher education ambition
Time spent studying
Student attends a paid class
First & Second semester grade
NEGATIVE CORRELATION
The following attributes had a negative correlation with the final score, G3:
Past failures
Student receiving support from school
Health
results
Exploratory analysis of the data showed the following:
NOTE:
- Since the goal is to be able to predict the final grade at the beginning of the semester, the first and second semesters' grades were excluded from the algorithm. However the features that affect these were included in the predictive model.
- Features that were positively correlated with the final grade were also removed from the grade prediction algorithm.
future work
It will be interesting to note what insights are drawn when:
These categories of students are exclusively analyzed; those taking:
- only Math
- only French, and
- both Math and FrenchStudies are made on how student grades is affected by the location of the college attended
Further analysis is done on the previous failures of the students and how it affects students' final grades
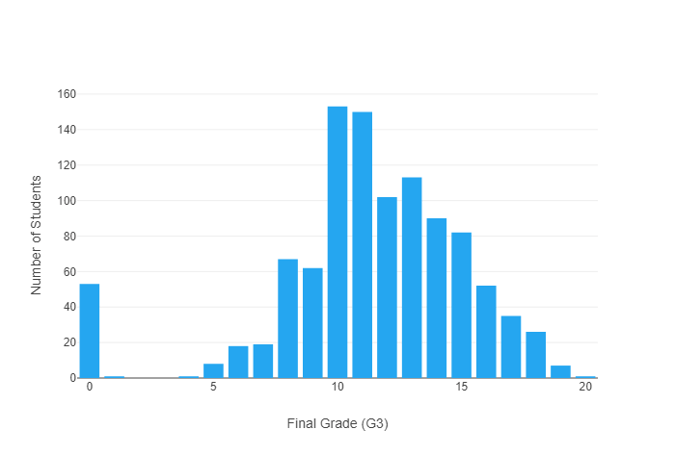
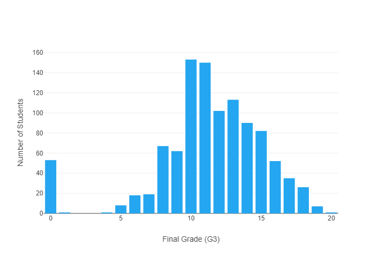
HOW EACH SIGNIFICANT PREDICTOR AFFECTS THE FINAL GRADE (G3)?
Average final grade is 14
About 72% of the students scored less than average
The most common grade is 10, scored by about 15% of the students
Minimun grade is 0, scored by 5% of the students
Maximum grade is 20, scored by 1 student
With respect to our target variable which is the final grade, the following were determined:


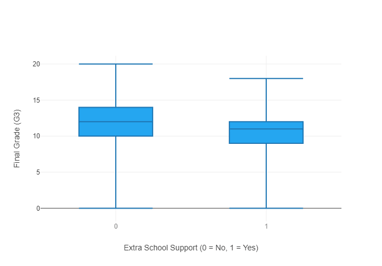
Extra School Support
Recommendations
The following are suggested in the strategic planning for the Ministry of Education:
Identify students with no interest in higher education and create supports for them in either higher education, a trade they're interested in, or further skill development
Create a study plan for students who have had a past failure
Increase the availability of access to tutelage for students in need
Encourage students to take extra classes if they can afford to do so. Provide bursarys and grants to those in need
Encourage and promote effective study time for students on and off campus
Foster physical and mental wellness to help students
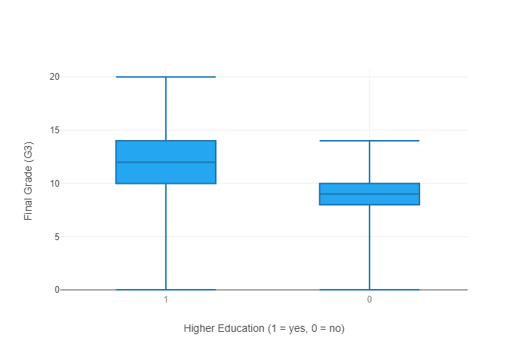
Desire for Higher Education
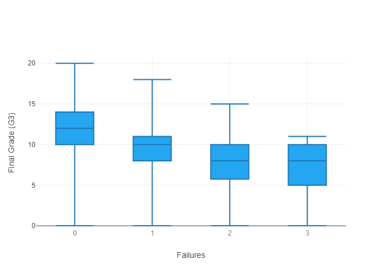
Number of previous failures
Students who did not receive extra support tend to score not too different scores than that of students who do. The medians are 12 and 11 respectively.
50% of students with:
- no extra school support scored between 10 and 14
- extra school support scored between 9 and 12
The final grade of the student decreases as the number of previous failues increases.
50% of students with:
- 3 previous failures scored between 5 and 10
- 2 previous failures scored between 6 and 10
- 1 previous failure scored between 8 and 11
- no failure scored between 10 and 14
The top 25% of students with:
- 3 previous failures scored between 10 and 11
- previous failures scored between 10and 15
- 1 previous failure scored between 11 and 18
- no failure scored between 14 and 20
A majority of students who wish to further their education scored higher than those who do not have the intention to.
The median score of the set o students with no desire for higher education lies outside the IQR of that of those with a desire for higher education.
50% of students with:
- a desire for higher education scored between 10 and 14
- no desire for higher education scored between 8 and 10
The top 25% of students with:
- a desire for higher education scored from 14 to 20
- no desire for higher education scored from 10 to 14
Since the median of the set of students with 1 previous failure falls ouside the IQR of the set of students with no previous failure, there is likely to be a difference between these 2 sets of students.
The same applies for students with 2 and 3 previous failures. These two categories of students both have a mdeian score that falls outside the IQR of students with no previous failure, and 1 previous failure.
All students sets have somewhat of a symmetrical distribution, witht he exception of the set with 3 previous failures which is left skewed.
MODEL PERFORMANCE
Predictive model was able to predict a student's final grade with 80% accuracy.